
Application Performance Monitoring Tool
From Code to Cloud. Complete Visibility.
Monitor application performance across distributed systems. Gain complete stack visibility from code-level insights to business metrics with zero-overhead instrumentation, powered by Motastore for real-time correlation of traces, metrics, and logs.
Application Performance Monitoring Capabilities
Full-stack observability with deep trace intelligence across every service and dependency.
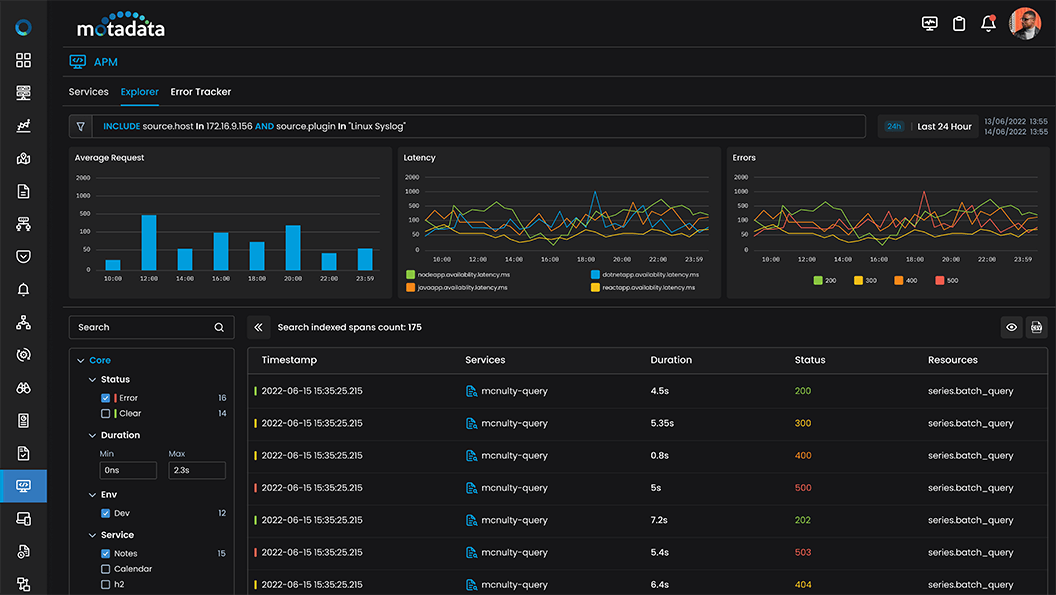
Unified Service Overview & APM Explorer
A single operational cockpit to instantly spot performance hotspots and map dependency-driven impacts using real-time application monitoring signals
Application Dependency Mapping – Leverage auto-discovery to visualize upstream and downstream interactions, helping you pinpoint bottlenecks across distributed architectures.
Explorer Tiles & Core KPIs – Assess the health of multiple services briefly tracking Response Time, Throughput, and Error percentage for a standard capability of the best application performance monitoring tools.
Click-Through Workflows – Filter by custom attributes or navigate seamlessly into Transactions, Errors, and Logs for deep, end-to-end application monitoring.
Transaction & Root-Span Prioritization
Leverage transaction-level trends and root-span prioritization to focus on high-impact operations.
Transaction Trends – Track Trace Count, Trace Duration, and Traces with Errors to proactively detect instability patterns before they impact your users.
Root Span Summary Grid – Surface your most dominant operations quickly by analyzing root spans alongside trace durations and error counts.
Trace Journey Drilldown – Dive straight from the root span into the full trace journey, equipping your team with the operational context needed for effective application performance monitoring.
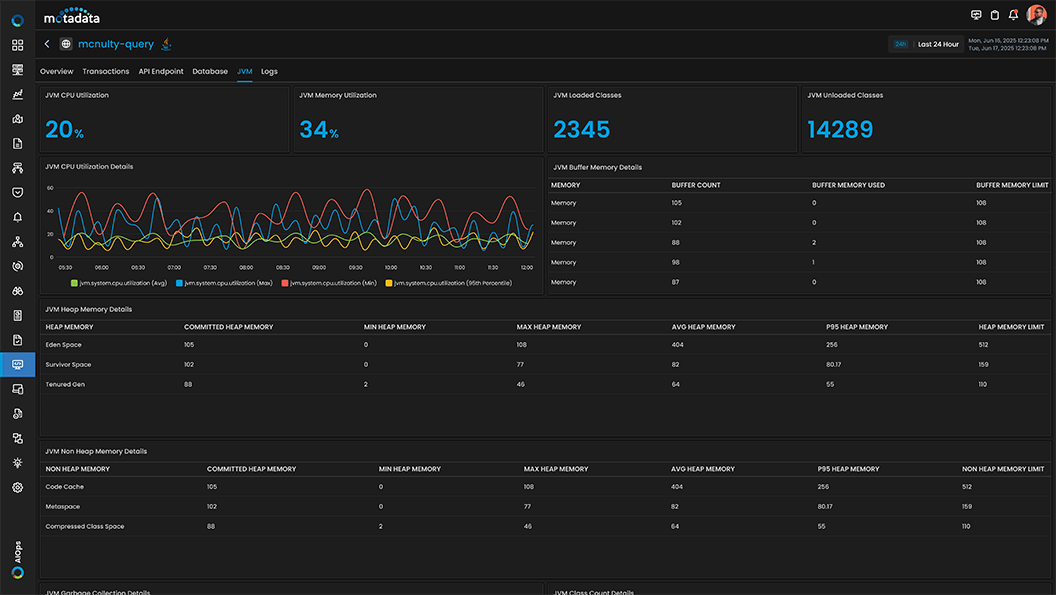
JVM Deep Visibility
Get comprehensive insights into JVM performance to address runtime bottlenecks, memory pressure, and thread behavior.
JVM Health Metrics – Deploy advanced application performance tools to monitor CPU utilization, memory usage, heap/non-heap space, and garbage collection statistics.
GC Insights – Analyze garbage collection events and their system impact to optimize memory usage and prevent costly application stalls.
Thread Activity & Class Monitoring – Track live, daemon, and sleeping thread states alongside class loading activity to spot potential memory leaks before they disrupt your apm software.
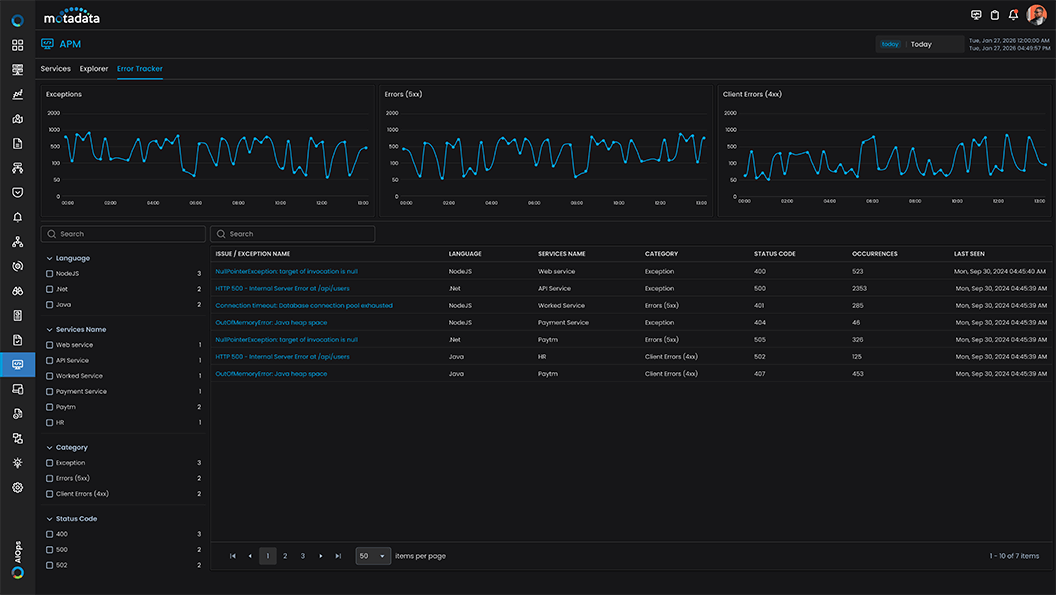
Error Tracker & Exception Intelligence
Turn failures into actionable work—track, drill down, and close the loop.
Error Tracker Console – Searchable, filterable error view with status codes and failure patterns.
Exception Drilldown – Occurrence trend + stack trace for root cause clarity and dev handoff readiness.
Severity-Led Prioritization – Focus fixes where error concentration and business impact are highest.
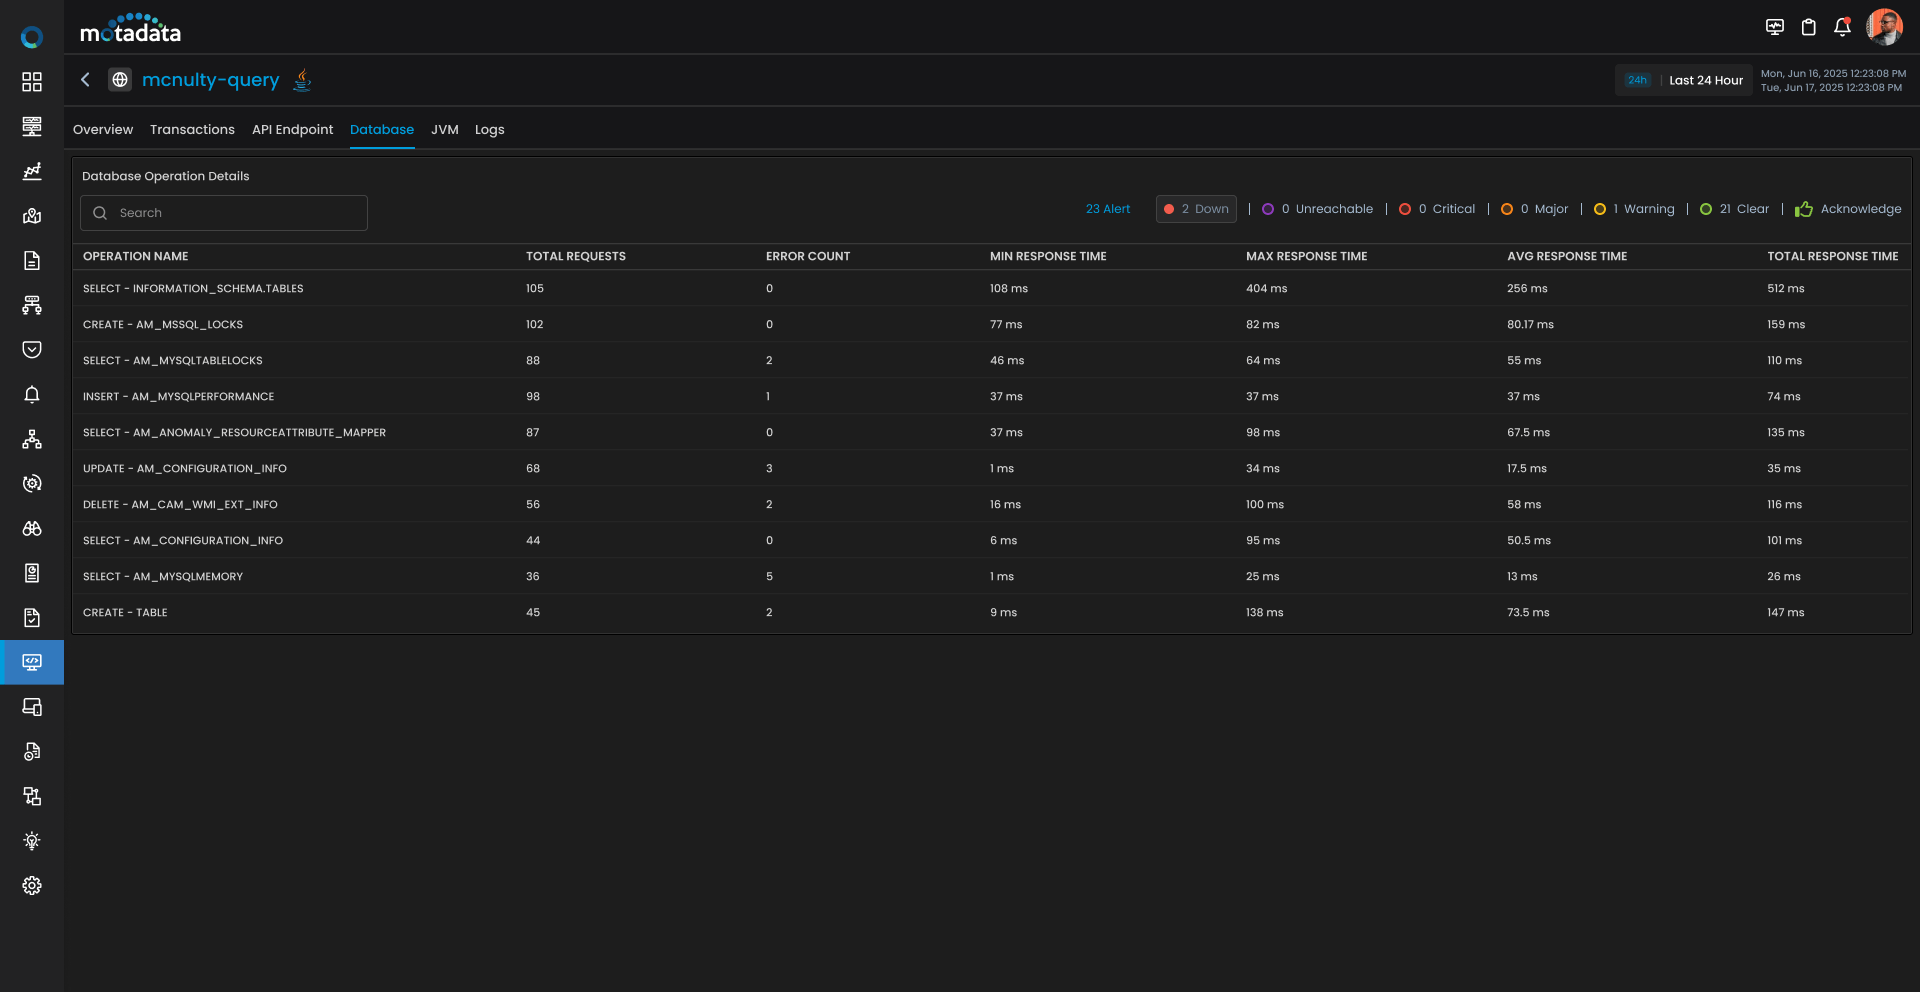
API Endpoint & Database Analytics
Ensure complete visibility across your stack by monitoring API route reliability and capturing contextual database activity.
Endpoint Health & Error Breakdown – Track traffic and latency per endpoint, and easily isolate failure-prone routes by drilling into 4xx/5xx error concentrations essential for cloud application performance monitoring.
Database Operations Tracking – Capture detailed query execution, latency, and throughput seamlessly as part of your comprehensive application performance monitoring software.
Contextual Insights & Tracing – Correlate trace data directly with database activity and jump seamlessly from any endpoint into a pre-filtered Trace Explorer. This full-stack capability cements our platform among elite application performance monitoring solutions.